0
1
2
3
4
5

我是程序员客栈的【昵称】,一名【二级方向】; 我毕业于【大学名称】,担任过【公司1】的【职位】,担任过【公司2】的【职位】; 负责过【项目1名称】,【项目2名称】,【项目3名称】的开发; 熟练使用【技术栈1】,【技术栈2】,【技术栈3】,【技术栈4】,【技术栈5】; 如果我能帮上您的忙,请点击“立即预约”或“发布需求”!
2015-06-22 -2024-06-14氣象局技術員
氣象的數據分析, 整理等專業開發應用。包括颱風, 氣候, 溫度濕度等指標進行數集和網頁的呈現。
2013-09-01 - 2015-06-27香港科技大學數學系硕士
香港科技大學數學系碩士
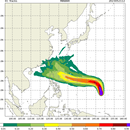
介紹 颱風路徑機率圖是由很多條颱風路徑而生成的機率圖,其中很知名的ECMWF也有一些圖片是形容這個機率圖 因為看見此圖, 感覺是很直觀計算的結果, 所以我試圖在網絡上尋找資料去計算在地圖每格點的機率計算方法, 幸運的是我找到 香港天文台的科普視頻並以它為起點 數據:使用ECMWF的ensemble的多路徑預測作為數據而生成的颱風機率圖 再者進行一些latitude,longitude 和 great circle的計算,最主要是運用一點到一直線距離的great circle版本。 最後使用python生成我的成果圖。 這個ECMWF的機率圖與香港天文台的圖片有些許不一樣, 香港天文台的結果(只有最新颱風的機率圖)較圓滑(比較如下表),估計是香港天文台將ECMWF的路徑數據經圓滑變曲線, 再進行機率計算, 這個猜測有機會再驗證。
Introduction MacauGIS is a self-study thesis system that focuses on representing the temperatures, humidity, and wind speed in Macau. The system offers the following key features: Wind animation Contour display Time series Slider for controlling the displayed map Interactie for three compontents: map, time series and slider. How It Works To use MacauGIS, follow these steps: Download and unzip the package. Open the package using Visual Studio Code (VSCode) and install the OnLive plugin.