 ********
 ********
个人介绍
我是 llqsee 我毕业于里昂大学,担任过武汉理工大学的研究助理与利物浦大学的研究助理; 熟练使用Python, Javascript, D3, Nodejs, SQL;拥有丰富的交互设计的经验与webapp的开发经验;拥有扎实的深度学习与机器学习的理论知识
工作经历
2023-02-01 -至今利物浦大学研究助理
就职于利物浦大学管理学院,主要工作为研究强化学习在优化问题中的应用。在这段经历中,主要完成工作为: 1) 搭建基于强化学习的特定应用领域的环境; 2)设计Q-learning算法,并优化Q-learning算法在应用过程中的局限,例如,Q-table的大小等。
2017-08-01 -2018-10-01武汉理工大学研究助理
在此经历中,主要工作为交通轨迹数据的分析与提取。在此期间,参与并完成以下工作: 1) 完成船舶轨迹的信息提取,其中包括速度,行驶状态等; 2)完成出租车轨迹数据的分析与模式挖掘。
教育经历
2018-10-23 - 2022-11-25里昂大学计算机科学与技术博士
2014-09-01 - 2017-07-31武汉理工大学智能交通硕士
2010-09-11 - 2014-07-31武汉理工大学轮机工程本科
技能

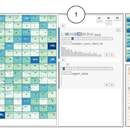
Understanding the mobility of geo-coded entities in geospatial data is important to many fields, ranging from the social sciences to epidemiology, economics, or air traffic control. Such entities remain challenging to visualize. Visualizing such entities can be challenging as it requires preserving both their explicit relationship properties (spatial trajectories) and their implicit properties (abstract attributes of those trajectories). Using the spatial nesting technique, an existing technique called Origin-Destinations maps preserves both explicit and implicit relationship properties of datasets. This work aims to generalize this technique beyond the origins and destinations dataset (2-attribute datasets) to explore multi-dimensional datasets (N-attribute datasets) with the nesting approach. We present an abstraction framework—we call GRIDIFY—and an interactive open-source tool implementing this framework using several levels of nested maps.

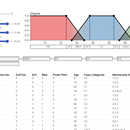
This interactive tool is used to categorize quantitative values into categories based on the fuzzy logic theory. FuzzyCut can derive several new attributes from the original dataset. For instance, age could be split into different categories, such as Children, Adult and Old. There are sliders and black points being adjusted to change the shape of the membership function. The new attribute Categories and Membership Degree are generated by adjusting those sliders.

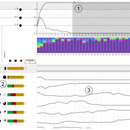
GroupSet is an interactive and web-based technique to facilitate the exploration of temporal charts. In particular, GroupSet relies on partial sets membership visualization to help users explore how quantitative values change over time. As shown in the following figure, we implemented a soccer team ranking data in GroupSet (as shown in Fig. 1). In ①, teams are categorized by rank into 4 sets (Top 5, Top 10, Bottom 10, and Bottom 5). Users can then explore the teams based on their memberships to those sets over a season and identify temporal patterns by manipulating a combination matrix of set intersections ②. The final view provided by GROUPSET is a filtered line chart corresponding to each set’s intersection showing teams with similar patterns ③ along with other attributes (e. g., change).


